Define the metric before anyone builds the report
Every operational metric hides a definition dispute. Does bed turnaround start at the discharge order, at the patient physically leaving, or at the ward notifying housekeeping? Each choice produces a different number and a different improvement target, and none of them is wrong — but a hospital that has not chosen cannot compare wards or months. Write the start event, end event, and exclusions down before a chart exists.
Definitions should attach to system events rather than human recollection. If turnaround begins at the discharge order, that order must be a timestamped action in the record, not a note written up later in the shift. HealUDoc derives these intervals from admission-discharge-transfer and housekeeping events as they occur, which removes the retrospective estimation that makes hand-compiled operational reports impossible to trust.

Capacity metrics that reveal the actual constraint
Occupancy is the headline but rarely the diagnosis. Pair it with admission-request-to-bed-assignment time, boarding duration for admitted patients still held in emergency or outpatients, discharge-order-to-bed-ready turnaround, and blocked-bed hours with reasons attached. Read together, these separate a genuine shortage of physical beds from a coordination delay, and the two problems call for completely different remedies.
Add assignment rework: how often a bed is allocated and then changed before the patient arrives. High rework usually means the decision is being made on incomplete clinical information, such as isolation requirements that surface afterwards. HealUDoc carries isolation, level of care, and mobility needs into the admission request itself, which is where rework is prevented rather than merely counted.

Capacity metrics worth reporting weekly
- Admission request to bed assignment
- Boarding hours for admitted patients
- Discharge order to bed ready
- Blocked-bed hours by reason
- Bed assignment changes before arrival
Theatre metrics beyond utilisation
Theatre utilisation is a seductive single number that can improve while performance worsens: running late inflates it, and cancelled sessions are often quietly excluded from the denominator. A balanced view needs first-case on-time starts, turnover distribution between cases, schedule accuracy comparing booked against actual duration, same-day cancellation rate with reasons, and access time for urgent cases waiting on the emergency list.
Schedule accuracy deserves particular attention because it drives everything downstream. Persistently underestimated durations create late finishes, overtime, and recovery congestion; persistently overestimated ones waste session time that could have taken a waiting patient. HealUDoc records booked and actual duration by surgeon and procedure, letting booking teams correct estimates with evidence instead of negotiating each case individually.

Support-service and equipment metrics
Support services stay invisible in operational reporting until they fail. Housekeeping turnaround by ward and shift, portering response time, and sterile services instrument availability all sit directly on the critical path of bed and theatre flow. A ward with poor turnaround frequently has an evening housekeeping coverage gap rather than a clinical problem, and only shift-level data will expose it.
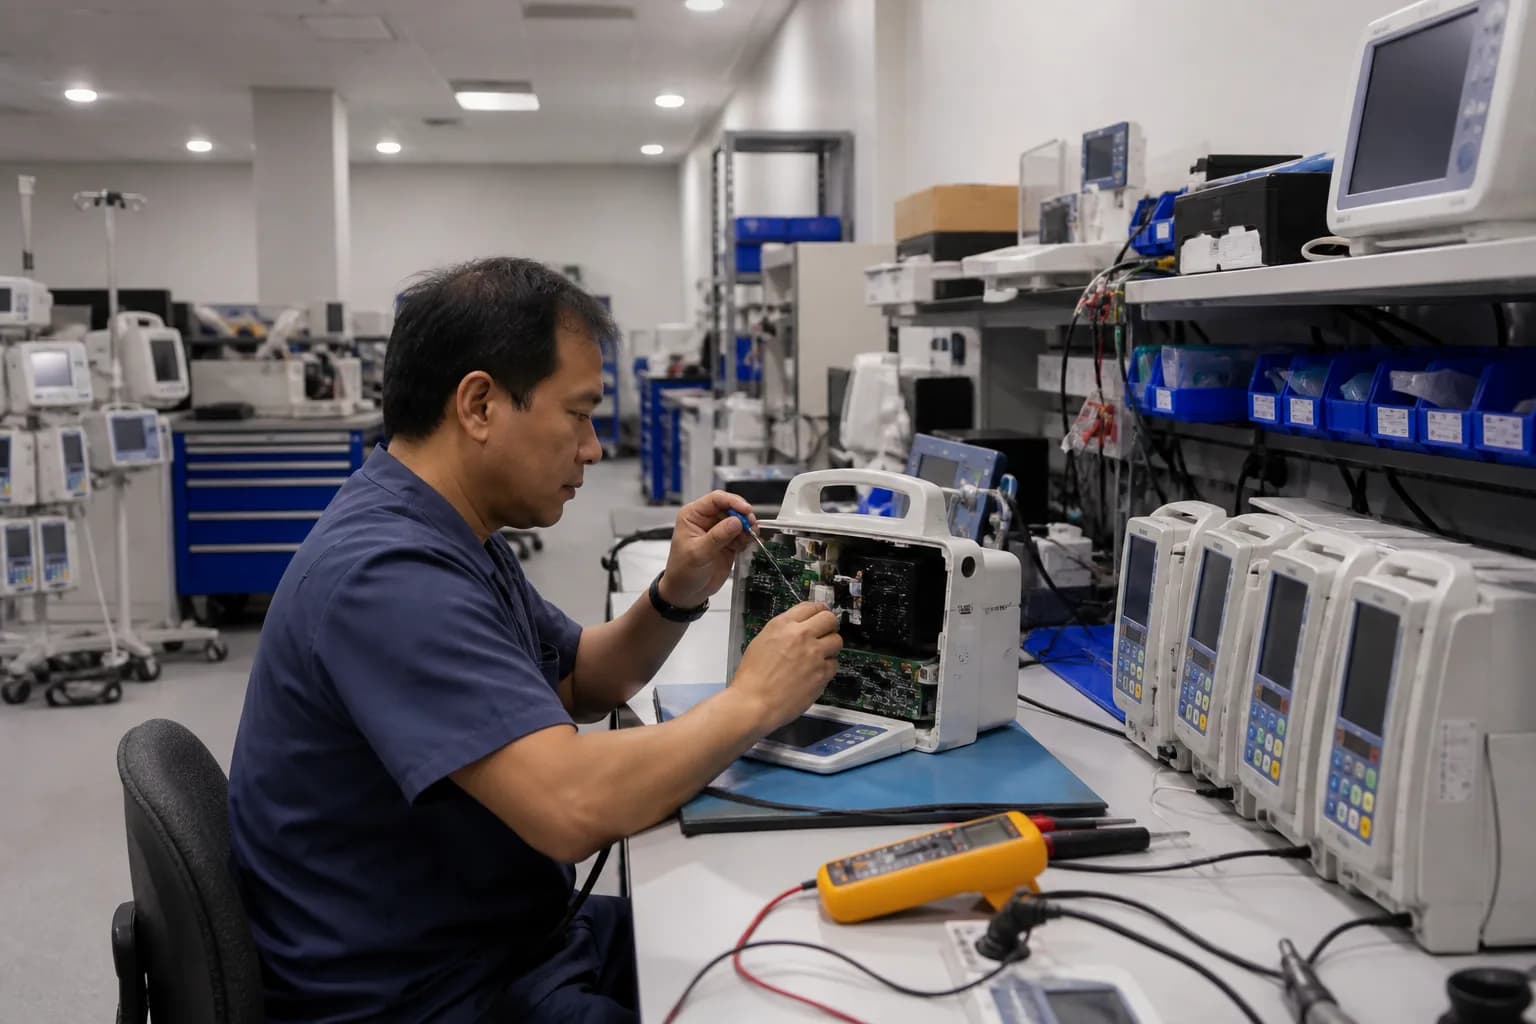
For biomedical equipment, track overdue preventive maintenance weighted by device criticality, downtime hours for critical devices, repeat failures on the same asset, and the share of the register lacking a named custodian. HealUDoc surfaces criticality alongside maintenance status, so a single overdue ventilator is not averaged away against fifty compliant infusion pumps in a headline compliance figure.

Support-service metrics that predict bed delays
- Housekeeping turnaround by ward and shift
- Portering response at peak discharge hours
- Sterile instrument set availability
- Downtime hours on critical devices
- Overdue maintenance on high-risk assets
Distributions, segmentation, and the tail
Reporting a mean is actively misleading in operations because these distributions are skewed. A handful of patients boarding for twelve hours barely move an average built from hundreds of two-hour waits, yet those are precisely the cases that generate harm and complaints. Report the median with the seventy-fifth and ninetieth percentiles, and treat movement in the tail as the signal worth acting on.
Segment before interpreting anything. Turnaround differs between a surgical ward and an intensive care unit, and theatre performance differs between a Monday elective list and a weekend emergency session. Group reporting should let a branch drill into its own wards without forcing every site into one benchmark, which is what HealUDoc's branch-aware dashboards preserve alongside the consolidated enterprise view.

Governance: every number needs an owner
A metric without an owner is decoration. Each number needs a named individual accountable for its definition, its data quality, and the action taken when it moves — usually an operations manager rather than an analyst. The analyst maintains the report; the owner explains the variance and commits to a response at a forum with the authority to move staffing or release capital.
Keep the reviewed set small. Fifteen governed metrics reviewed monthly with genuine follow-up will change more than sixty on a dashboard nobody opens. Retire measures that have stopped driving decisions, and resist adding a new one after every incident. When a definition changes, restate the history or annotate the break, because an unexplained step change erodes trust in the entire set.
“The turning point was not a better dashboard. It was naming one person for each metric who had to explain it out loud every month.”