Which clock starts where, and why the answer decides everything
Radiology turnaround time is not one number, it is a choice about two timestamps, and hospitals argue past each other because they have quietly chosen different ones. A referring physician means the time from writing the order to reading the report. A radiologist usually means the time from images being available to signature. A department manager reporting to a board often means the time from acquisition to report release, because that is the interval the department controls. All three are defensible. Only one of them answers the complaint the physician actually made.
Radiology TAT also differs structurally from laboratory TAT, and borrowing the laboratory framing produces poor decisions. A laboratory sample moves through processes that are largely instrument-paced and can be parallelised by adding analyser capacity. An imaging study contains an irreducible human interpretive step whose duration depends on case complexity and on the availability of one specific qualified person. You cannot buy your way out of a reporting backlog the way you can buy a second analyser.
The practical recommendation is to define and publish three intervals rather than one, and to name them unambiguously in every report you circulate. Order to acquisition, acquisition to report available, and order to report available as the total. Once those names are fixed, an argument about whether turnaround is improving becomes a question about data rather than a difference in vocabulary.
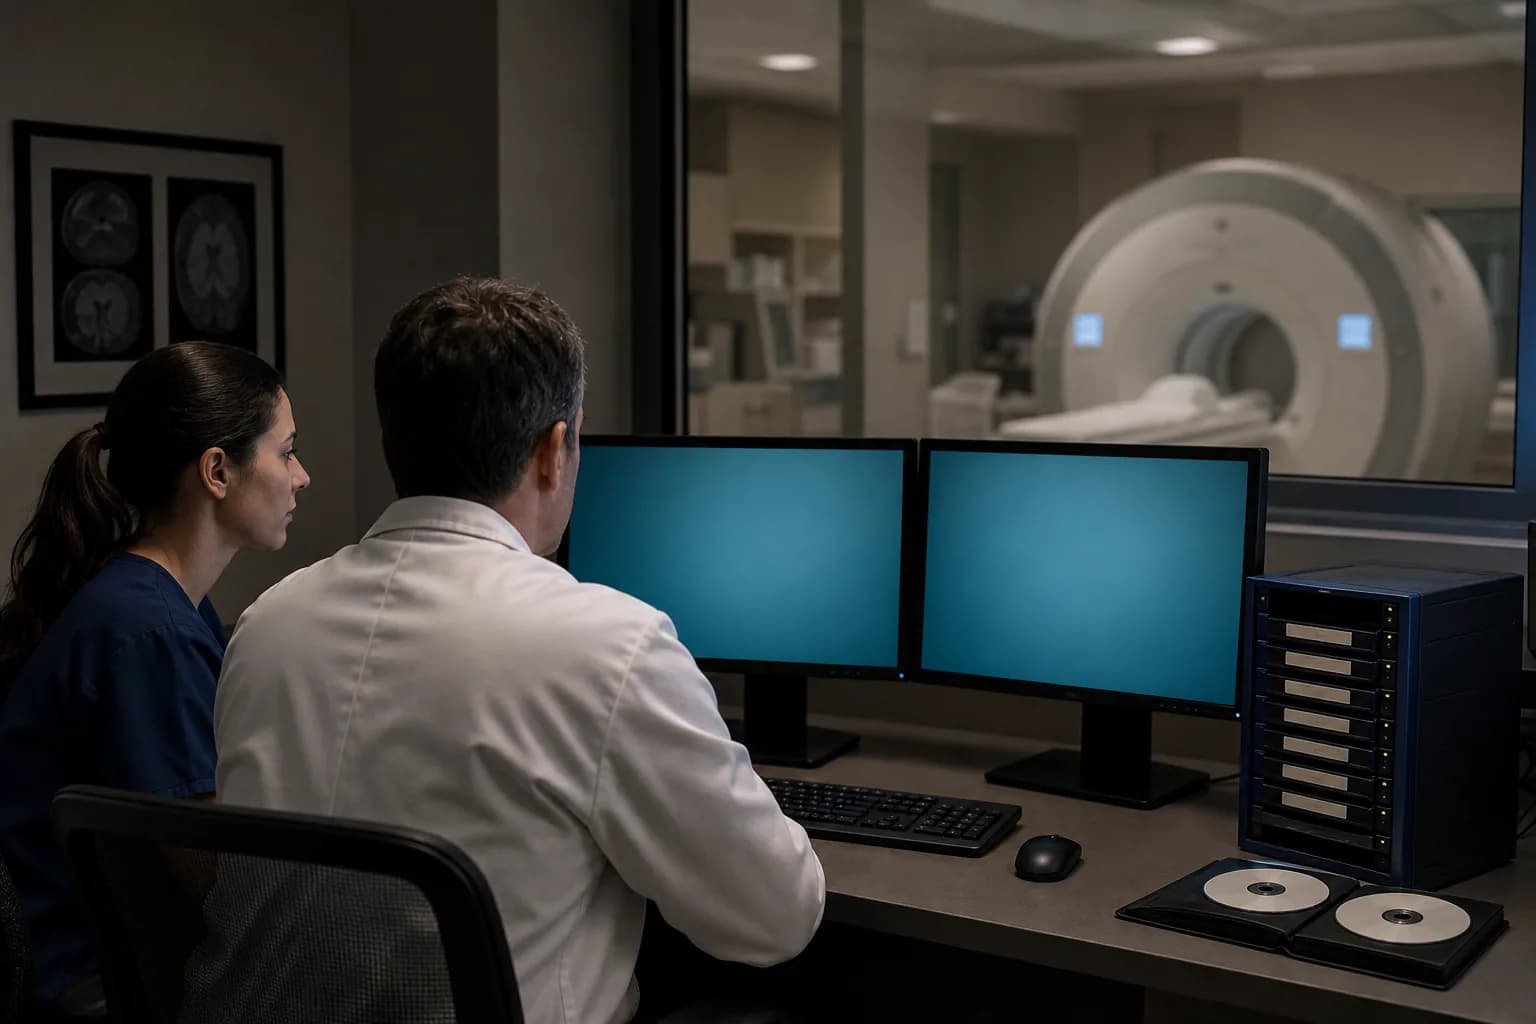
The intervals worth measuring separately
Break the total into segments that map to a responsible role, because a segment nobody owns will never improve. Order placed to order protocolled belongs to the radiologist or senior technologist who decides the protocol. Protocolled to patient present belongs to scheduling and to portering for inpatients. Patient present to acquisition complete belongs to the technologist and the machine. Acquisition to images available in the archive belongs to IT. Available to assigned belongs to whoever runs the reading rota. Assigned to draft belongs to the reporting radiologist. Draft to signed belongs to the reviewing consultant where trainees draft.
Seven segments looks like over-engineering until the first time you use it. A department told that its turnaround is nine hours cannot act on that. A department told that acquisition to assignment averages four hours on weekday evenings can act on it immediately, because the cause is almost certainly that nothing is assigned after the day rota ends and studies queue until morning. The segmentation converts a complaint into a scheduling decision.
Not every hospital can capture all seven timestamps, and it is better to measure four honestly than seven with two of them derived from assumptions. Start with whatever your systems genuinely record: order time, acquisition time from the DICOM study header, report first-saved time and report signed time. Those four give you three intervals and are usually available without any new development.
Timestamps to confirm your systems actually capture
- Order placement time from the ordering screen, not the billing time
- Protocolling decision time where protocolling is a distinct step
- Study acquisition time taken from the DICOM header rather than typed
- Assignment time when a study enters a specific radiologist's worklist
- Report signature time, distinguished from the time the draft was first saved
The seven bottlenecks, in the order they usually bite
The first and most common is the evening and weekend gap. Studies acquired after the reporting rota ends sit until the next working session, which single-handedly creates the long tail in most Indian hospitals' distributions. The second is protocolling delay for cross-sectional studies, where a CT or MRI order waits for a radiologist to decide sequences and contrast. The third is patient preparation, particularly fasting and creatinine results before contrast studies, which shows up as an order-to-acquisition delay that the department is blamed for and does not control.
The fourth is prior study retrieval. A radiologist who cannot see the comparison study will either wait or report without it, and both outcomes are bad. The fifth is the dictation and transcription loop where it still exists, which adds a queue and a correction cycle. The sixth is consultant sign-off in teaching and multi-consultant setups, where a drafted report waits for a specific person who is in theatre. The seventh is the report delivery step itself, where a signed report sits unreleased because an interface failed or a manual dispatch was missed.
Notice that only two of these seven are about radiologist reading speed. This matters, because the instinctive response to a turnaround complaint is to press radiologists to read faster, which is the intervention with the poorest return and the highest cost in reporting quality and staff goodwill. Fix the queues before you touch the reading step.
Diagnostic questions to ask when turnaround worsens
- Is the delay concentrated in particular hours of the day or days of the week
- Is it concentrated in one modality, or across all of them
- Does the tail sit before acquisition or after it
- Are stat studies genuinely bypassing the routine queue, measured rather than assumed
- Did report volume rise, or did reporting capacity fall, or both
Segmenting by modality and priority, because averages hide everything
A single departmental average blends a chest radiograph reported in twenty minutes with an MRI spine reported the next morning, and the resulting figure describes nothing that exists. Report turnaround separately by modality at minimum, and ideally by modality crossed with priority and with patient class. Emergency CT head, inpatient ultrasound and outpatient MRI are three different services with three different reasonable expectations, and combining them guarantees that improving one and worsening another looks like no change at all.
Use percentiles rather than means. The mean is dragged around by the small number of studies that took two days, while the experience most clinicians have is closer to the median. Reporting the median alongside the ninetieth percentile tells you both what normally happens and how bad the bad cases are. A department whose median is thirty minutes and whose ninetieth percentile is eighteen hours has a specific, findable problem, and its mean of three hours would have told you nothing.
Set targets per segment and set them at a level you have a plan to achieve. A target adopted from an overseas benchmark, applied to a department with one radiologist covering nights from home, is a target that will be missed every month until everyone stops looking at the report. It is better to publish a target you can defend and tighten it than to publish an aspiration and normalise failure against it.
What NABH expects you to be able to demonstrate
Accreditation does not hand you a turnaround number to hit. What the imaging standards ask is that the hospital defines the expected turnaround time for its own services, communicates it, monitors performance against it, and acts when performance falls short. An assessor is therefore looking for four artefacts: a documented definition, evidence that it was communicated to clinicians, a trend of measured performance, and minutes showing that a deviation was discussed and something was decided.
Critical and unexpected findings sit alongside turnaround as a separate expectation, and they are assessed more sharply because the risk is immediate. You need a defined list of what counts as critical for imaging, a defined communication route, a defined acknowledgement, and a record of each event. Departments that fold this into general turnaround reporting usually cannot produce the individual event records when asked.
The gap most often found is not measurement, it is the loop being closed. Many departments produce a monthly turnaround chart faithfully and nobody has ever acted on it. An assessor asks what changed as a result of the last three months of data, and the honest answer is nothing, at which point the indicator is documentation rather than quality management. Pick fewer indicators and act on them.
Interventions that move the number, and what each costs
Extending reporting cover into the evening is the intervention with the largest single effect in most hospitals, because it attacks the overnight queue directly. It costs money and it costs consultant goodwill, and it is often resisted on the grounds that overnight volume is low, which misses the point that low volume with a twelve-hour delay still produces a terrible ninetieth percentile. A partial version, such as a defined evening reporting session rather than full cover, captures much of the benefit.
Worklist automation is the cheapest meaningful change. Auto-assigning studies by modality and subspecialty, surfacing stat studies at the top with a visible timer, and alerting when a study has been unassigned beyond a threshold removes the manual allocation step that quietly adds hours. It requires the workflow states discussed earlier to actually exist in your system, which is why hospitals with only ordered and completed states cannot do it.
Structured reporting templates cut drafting time for high-volume routine studies and improve consistency, at the cost of a real adoption effort and some genuine loss of nuance if templates are imposed on complex cases. Use them where the study is repetitive and the report is largely normal. Teleradiology for overflow is a fourth option and carries its own contractual, credentialing and data protection obligations that need handling properly rather than as an afterthought.
“We spent a year pushing radiologists to read faster and moved the average by minutes. Then we added one evening reporting session and the ninetieth percentile halved. The bottleneck was never reading speed.”
Reporting the metric so it survives a quality committee
Publish the definition alongside the number, every time, on the same page. Which timestamps, which studies included, which excluded, and what happened to cancelled and repeated studies. Half the disputes in a quality committee are about whether the number is real, and a definition printed on the chart ends most of them before they start. Where the definition changes, mark the date on the trend line rather than quietly restating history.
Show the distribution, not only the summary. A simple histogram or a median-with-percentile band communicates more than a single line, and it makes the long tail visible to people who would otherwise assume the average describes their experience. Add volume as a second series, because turnaround interpreted without workload is how departments get criticised for a bad month that was actually a record month.
Finally, attach one action to each report. Not a plan, an action with an owner and a date, drawn from the segment that is worst. A monthly imaging turnaround report that carries a single closed action from last month and a single open one for this month is a functioning quality system. One that carries twelve charts and no actions is a document, and both an assessor and your own clinicians will read it that way.