
The network had occupancy data but little foresight
Greenway Health operated three branches with recurring emergency crowding and last-minute elective cancellations. Leaders reviewed monthly occupancy, which arrived too late and averaged away weekday and seasonal peaks. Departments kept separate spreadsheets with conflicting bed and discharge definitions.
The network established a single question: how much care-ready capacity would each service need over the next twelve weeks. A joint team included clinical operations, nursing, finance, data engineering, and quality. They agreed to preserve local context while standardizing core definitions.
Building a trustworthy demand baseline
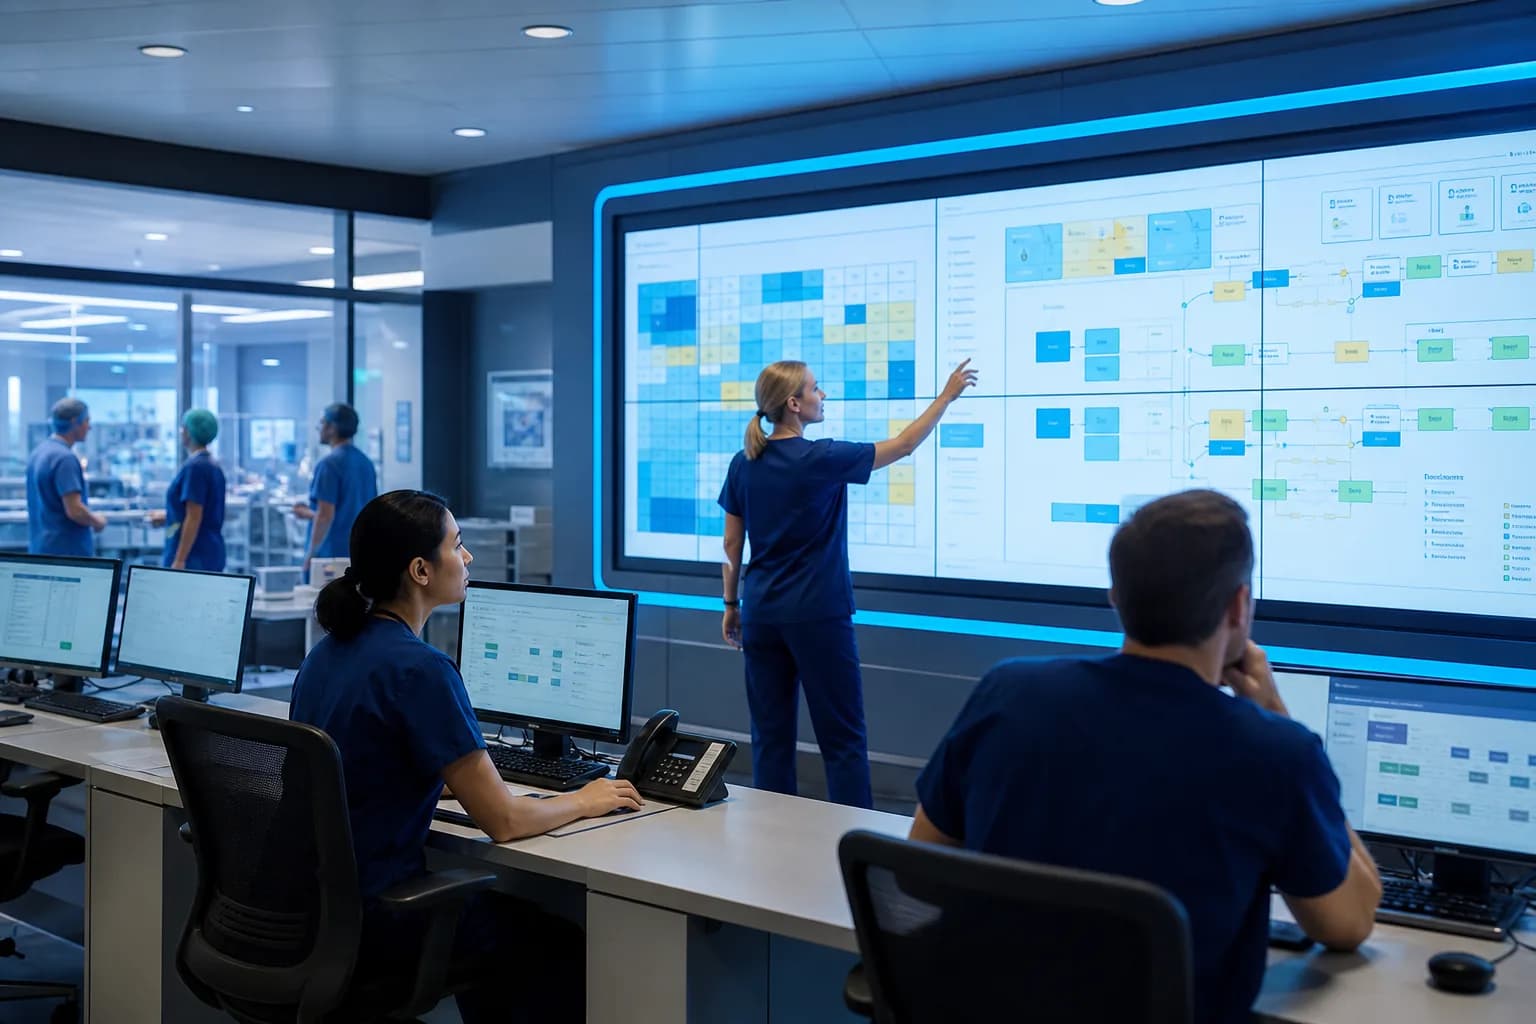
Analysts combined emergency arrivals, planned admissions, OPD referrals, theatre schedules, transfers, and historical seasonality. They separated demand from completed admissions because diversion and cancellation concealed unmet need. Duplicate and merged encounters were reconciled before modeling.
Length of stay was segmented by service, acuity, discharge destination, and branch instead of using one hospital average. The team documented pandemic periods, closures, and policy changes that distorted history. HealUDoc supplied governed data from IPD, OPD, lab, pharmacy, and billing milestones.

Core planning inputs
- Emergency and elective demand
- Acuity-adjusted length of stay
- Theatre and clinic schedules
- Staffed bed availability
- Seasonal and local events
Forecasting scenarios instead of one answer
The first model produced a range for arrivals and occupied bed-days rather than a precise point forecast. Scenarios tested influenza peaks, staffing loss, theatre growth, and temporary branch closures. Leaders could see assumptions and revise them without rebuilding the model.
Back-testing compared predictions with periods excluded from training and highlighted weak service lines. Error bands widened when data was sparse, preventing false confidence. Clinical leaders reviewed whether modeled relationships remained plausible after workflow changes.
Connecting forecasts to operational levers
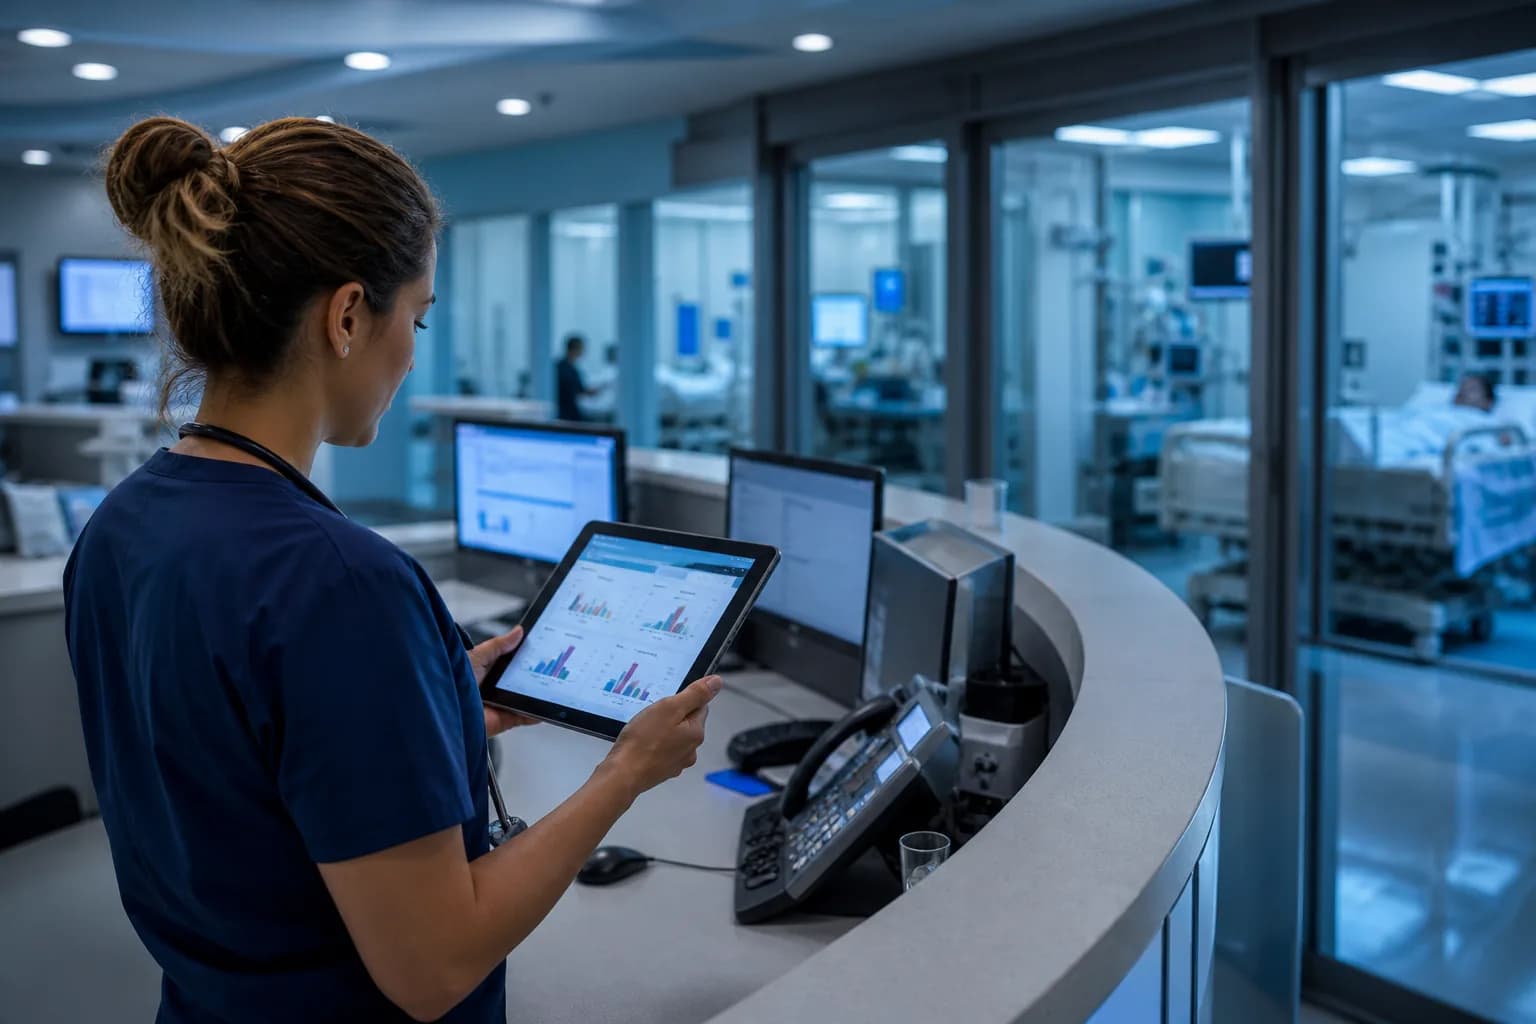
A forecast only creates value when it changes a controllable decision. Greenway linked thresholds to staffing pools, elective release rules, discharge coordination, inter-branch transfers, and temporary care areas. Each action had a lead time and accountable executive.
The team modeled care-ready beds, not physical rooms, by including nurse ratios, isolation, oxygen, and equipment. It also protected safety constraints that could not be traded for throughput. Finance reviewed cost, but quality monitored readmissions, incidents, and staff workload.

Actions triggered by pressure
- Activate flexible staffing
- Adjust elective release
- Strengthen discharge coordination
- Transfer across branches
- Open validated surge areas
Results and course corrections
Within two planning cycles, Greenway moved staffing decisions earlier and reduced avoidable day-of-surgery cancellations. Forecast error remained higher in pediatrics, where outbreaks created abrupt demand. The team added external surveillance and retained wider uncertainty bands.
A weekly forum compared forecast, actual demand, actions taken, and balancing measures. Leaders recorded when judgment overrode a recommendation and reviewed the result. This created learning data without turning the model into an unquestionable authority.

“The forecast did not make decisions for us; it gave every branch time to make better ones together.”
Transferable lessons
Begin with consistent operational definitions and a narrow decision horizon before attempting advanced machine learning. Expose assumptions, uncertainty, and missing data to the people using the result. A simpler model reviewed weekly often outperforms a sophisticated model nobody trusts.
Measure action lead time, cancellation, boarding, staff strain, quality outcomes, and forecast error together. Recalibrate after service redesign or major demand shifts. Capacity planning should remain a governed management process supported by analytics.