What a readmission model is actually for
Predicting hospital readmissions is not an intellectual exercise in ranking patients by risk. The only defensible purpose is to change what happens to a specific patient before they leave the ward — a pharmacist review, a follow-up call at day three, a scheduled review appointment, a referral to home care. If no such action exists and no one owns it, the model produces a number that makes a dashboard look sophisticated and helps nobody.
This reframes the whole project. The first question is not which algorithm to use but which intervention has capacity, who delivers it, and how many patients per week they can absorb. If the discharge coordinator can call twenty patients a week, you need a model that identifies the twenty highest-value candidates, not one that produces a beautifully calibrated probability for every discharge. Capacity determines the operating point, and the operating point determines what the model must be good at.
It also determines what counts as success. A readmission programme succeeds when the readmission rate in the intervened group falls relative to a comparable group — not when the model's discrimination statistic improves. Teams that measure the model instead of the programme tend to end up with an excellent model and an unchanged readmission rate.

Define the readmission window and exclusions first
Before any data is pulled, write down what a readmission is. The common convention is an unplanned admission within thirty days of a previous discharge, but every word in that sentence needs a local ruling. Does an admission to a different branch count? Does a planned staged procedure count — it should not. Does a day-care dialysis session count as an admission? Does a patient who leaves against medical advice and returns count, and should they?
Exclusions matter as much as inclusions. Deaths during the index admission, transfers out to another facility, obstetric deliveries, and planned chemotherapy or dialysis cycles are typically excluded because they are not the phenomenon you are trying to prevent. Each exclusion should be justified in writing, because someone will eventually compare your rate to a published figure and the comparison is meaningless unless both definitions are known.
Write the definition into the data dictionary, version it, and date it. If the definition changes — and it will, once a clinician points out something the first version got wrong — the historical series must either be recomputed under the new rule or clearly broken at the change point. Silently changing a denominator is one of the fastest ways to lose clinical trust in an analytics team.
Definition decisions to settle in writing
- Window length and whether it runs from discharge or from admission
- Whether readmission to any branch or only the index branch counts
- Planned versus unplanned classification rule and who applies it
- Excluded populations: deaths, transfers out, planned cyclical care
- Treatment of same-day returns and emergency department revisits
Only use features that exist at discharge
A model that will run at discharge may only use information available at discharge. This sounds obvious and is violated constantly, usually through fields that are populated after the fact — a final coded diagnosis assigned by the records department a week later, a discharge summary completed retrospectively, a billing category finalised at claim submission. Each of these leaks information from the future and produces a model that performs beautifully in validation and poorly in production.
The features that are genuinely available are richer than teams expect: length of stay, admission source, number of prior admissions in the last six and twelve months, medication count at discharge, presence of specific chronic conditions on the problem list, laboratory values from the last twenty-four hours, and whether a follow-up appointment was booked before discharge. Prior utilisation is usually the strongest single signal, and it is available immediately.
Build the feature set against a point-in-time snapshot of the warehouse rather than against current state. If your dimensions carry effective dates, you can reconstruct exactly what was known at 4 p.m. on the day of discharge. Without that history, you cannot reliably distinguish a legitimate feature from a leak, which is a strong practical argument for the versioned dimension design in the first place.

Route the output to an intervention, not to a report
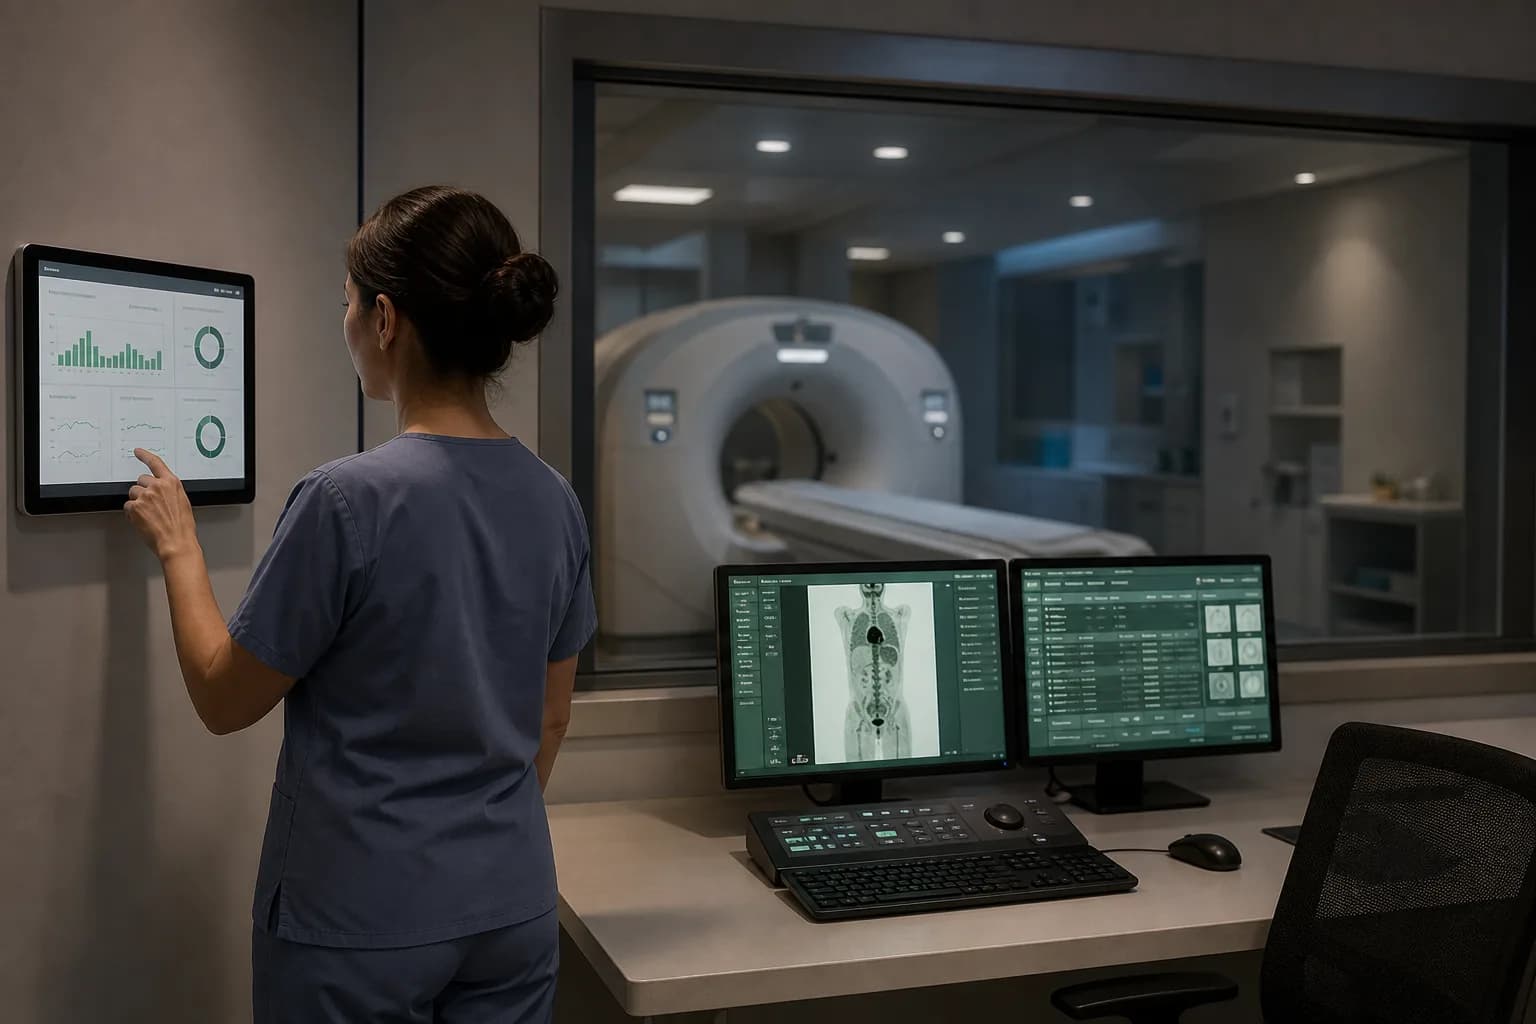
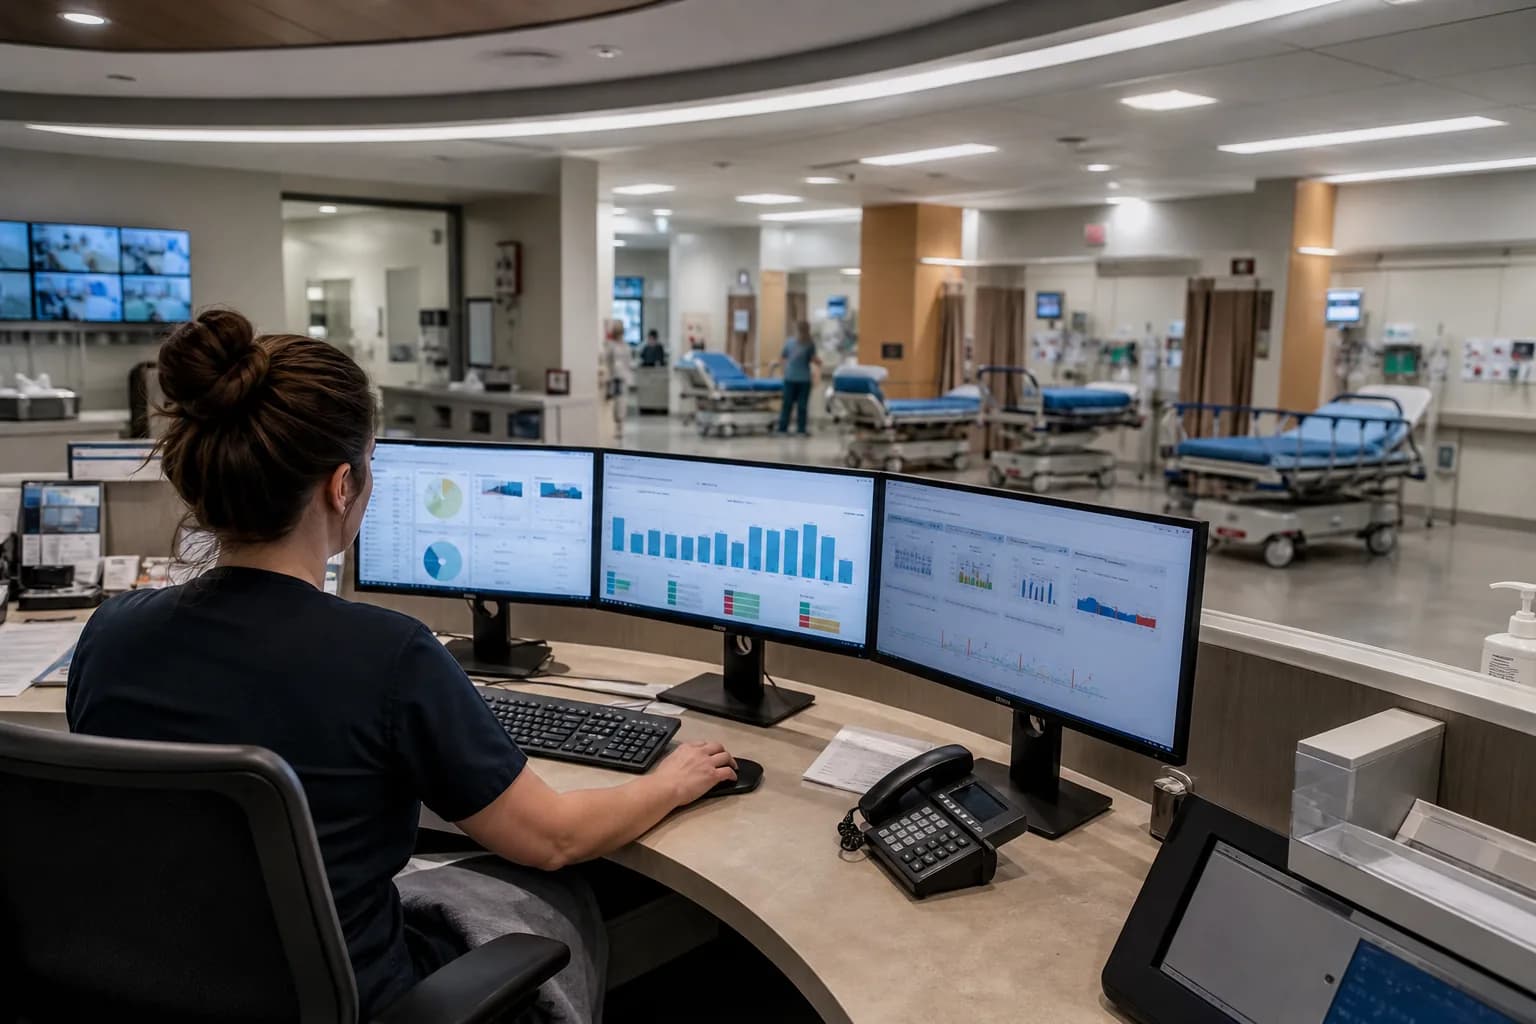
The model output must arrive somewhere a human is already looking, at a moment when they can act. A risk flag on the discharge checklist in the ward workflow gets acted on; the same flag in a weekly emailed spreadsheet does not. This is a workflow integration problem far more than a modelling problem, and it is where most readmission projects quietly die.
Design the action alongside the flag. High risk plus polypharmacy routes to a pharmacist medication review; high risk plus no booked follow-up routes to the appointment desk; high risk plus a social vulnerability marker routes to the medical social worker. A single undifferentiated flag that says only that this patient is risky leaves the ward team to invent a response, and under pressure they will not.
Systems that keep discharge, appointments, pharmacy, and follow-up in one operational platform — HealUDoc among them — make this routing considerably less painful, because the flag and the action live in the same place. Where systems are separate, be explicit about the handoff and instrument it, so you can tell the difference between a model that missed a patient and an intervention that was never delivered.
Calibration, thresholds, and drift monitoring
Discrimination tells you whether the model ranks patients correctly; calibration tells you whether a predicted probability of twenty per cent corresponds to roughly twenty per cent of such patients actually returning. For a clinical conversation, calibration matters more, because clinicians will reason about the number as a probability whether or not you intended them to. Check calibration by risk decile and recheck it after every retrain.
The threshold is an operational decision, not a statistical one. Set it where the number of flagged patients matches the intervention capacity you established at the start, and revisit it when capacity changes. Be explicit with the clinical team about the trade-off: a lower threshold catches more eventual readmissions and burns more coordinator time on patients who would have been fine.
Then monitor for drift, because the hospital will not hold still. A new consultant, a changed discharge protocol, a shift in payer mix, or a seasonal outbreak all move the input distribution. Track the distribution of key features, the flag rate, and the observed readmission rate in flagged and unflagged groups on a monthly basis, and set a rule in advance for what triggers retraining or suspension.

Monitoring signals worth a monthly review
- Flag rate against intervention capacity
- Calibration by risk decile, predicted versus observed
- Feature distribution shift against the training period
- Intervention delivery rate for flagged patients
- Readmission rate in flagged and unflagged groups
Avoiding bias against underserved patients
Readmission risk correlates with circumstances that have nothing to do with clinical severity: distance from the hospital, ability to pay for medicines after discharge, literacy, whether anyone at home can supervise care, whether the patient can take a day off to attend follow-up. A model trained on historical outcomes will learn these patterns, and that is not inherently wrong — those patients genuinely are at higher risk and arguably most deserve the intervention.
The harm appears when the output is used to ration rather than to support. If a high risk score is used to discourage admission, to demand advance deposits, or to shorten a stay, the model has become a mechanism for withholding care from the people who need it most. Write down the permitted uses of the score, and write down the prohibited ones, before the model reaches production.
Evaluate performance separately across subgroups you can defensibly measure — payer category including PM-JAY and CGHS or ESIC beneficiaries, age band, urban versus rural residence. If calibration is materially worse for one group, the model is less reliable for them and you should say so rather than quietly ship it. Involve the clinical governance committee in that review; this is a governance decision, not a data science one.
“The moment we could see that the score was highest for patients who could not afford the follow-up medicines, the question stopped being how accurate the model was and became what we were prepared to do about it.”
A staged rollout that earns clinical trust
Run silently first. For six to eight weeks, generate scores without showing them to anyone, and compare predictions to what actually happened. This catches leakage, definitional errors, and data pipeline failures at zero clinical cost, and it gives you an honest baseline readmission rate to measure against later.
Then pilot on one ward or one service line with a named clinical champion, a defined intervention, and a weekly review of every flagged patient. The review meeting is where the real learning happens — clinicians will tell you within three sessions which flags are obviously right, which are obviously wrong, and which features the model is missing entirely.
Expand only when the intervention is being delivered reliably, not when the model looks good. A programme where eighty per cent of flagged patients receive the intended follow-up, using a mediocre model, will outperform a programme with an excellent model whose flags are delivered to nobody. The model is the cheap part; the operational discipline around it is the whole job.